OMA HOW TOs
Guide 1: How to Find Your Favorite Gene in OMA 5
Guide 2: How to get basic information on Your Favorite Gene and genome 11
Guide 3: How to get the orthologs of Your Favorite Gene in OMA 15
Guide 4: How to get the evolutionary history of Your Favorite Gene in OMA 17
The first step to using OMA is finding your favorite gene (YFG). YFG might be in a journal article, with its assigned accession number or annotation identifier. Alternatively, you may only have a sequence of YFG, and want to find the closest match in OMA. This guide will show how to find it in the OMA browser. OMA can be found at omabrowser.org.
When working with the OMA database, the main identifier you will see used on the browser is the “OMA ID.” This is a unique identifier for each canonical gene in the database, consisting of the 5-letter UniProt species code + a 5 digit number. However, it is possible to search by external identifiers as well.
Example A: The Tomato DELLA Protein PROCERA Acts in Guard Cells to Promote Stomatal Closure
Find the accession number or identifier for YFG in the paper. Here, we take the PRO gene, Solyc11g011260: (http://www.plantcell.org/content/29/12/3186-sec-23)
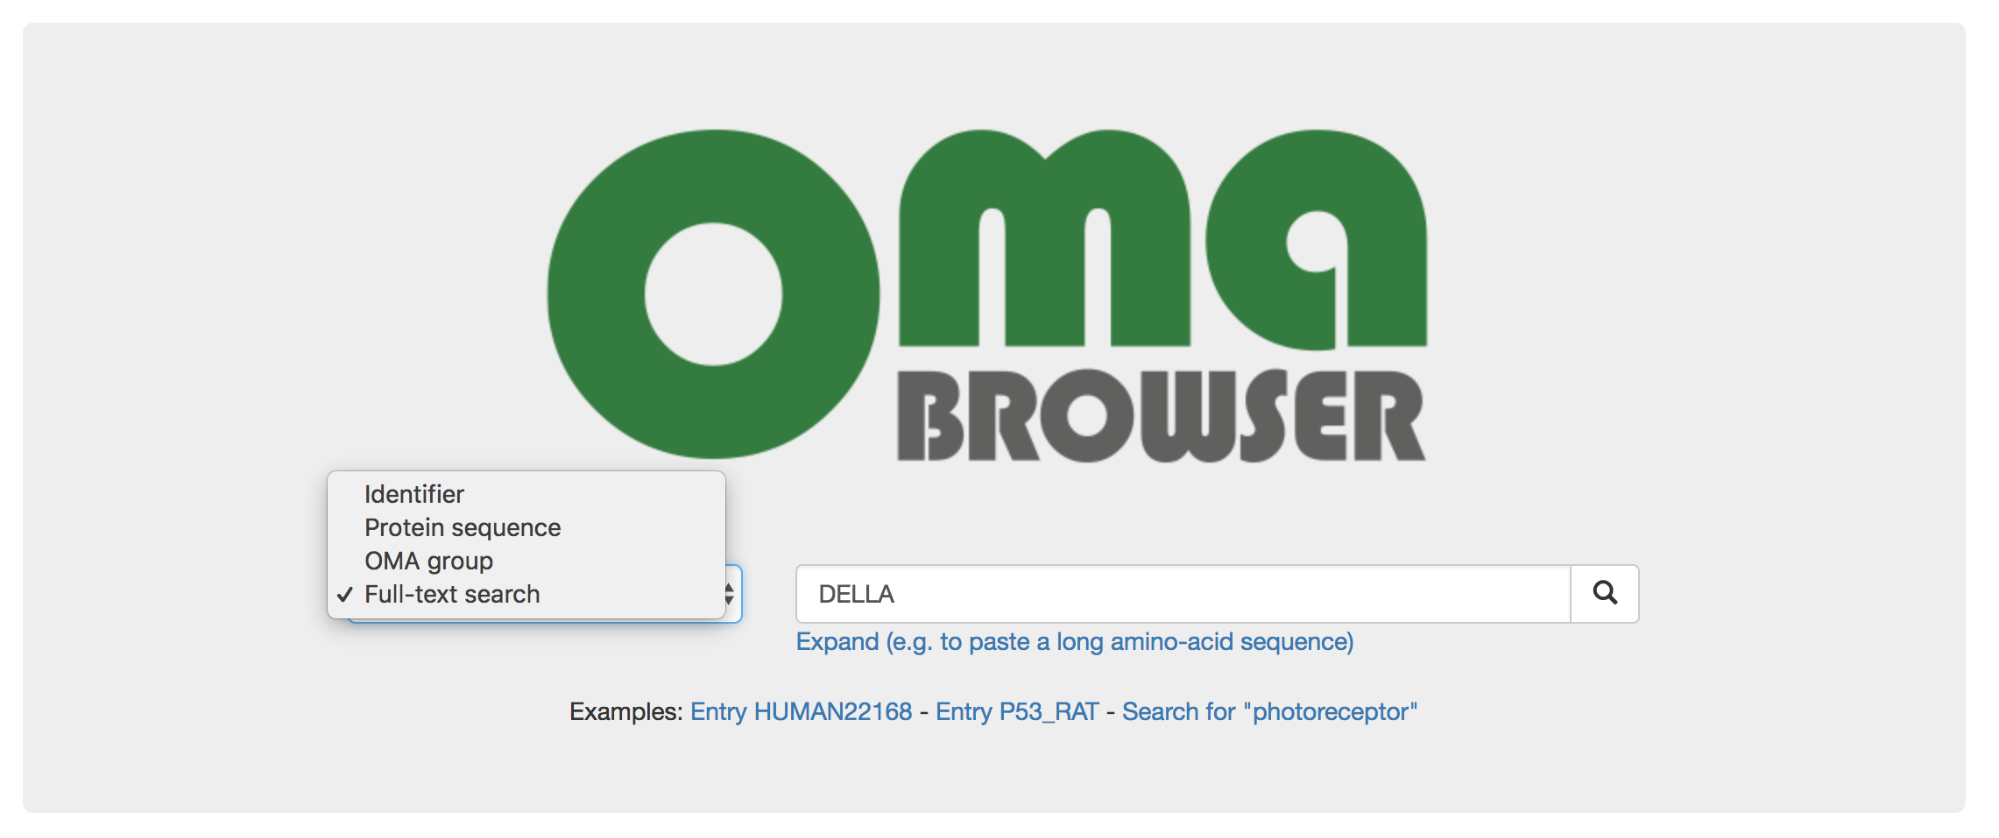
Copy and paste YFG’s identifier in the search bar on the OMA home page.
Select “Full-text search” in the drop down menu and search “DELLA.”
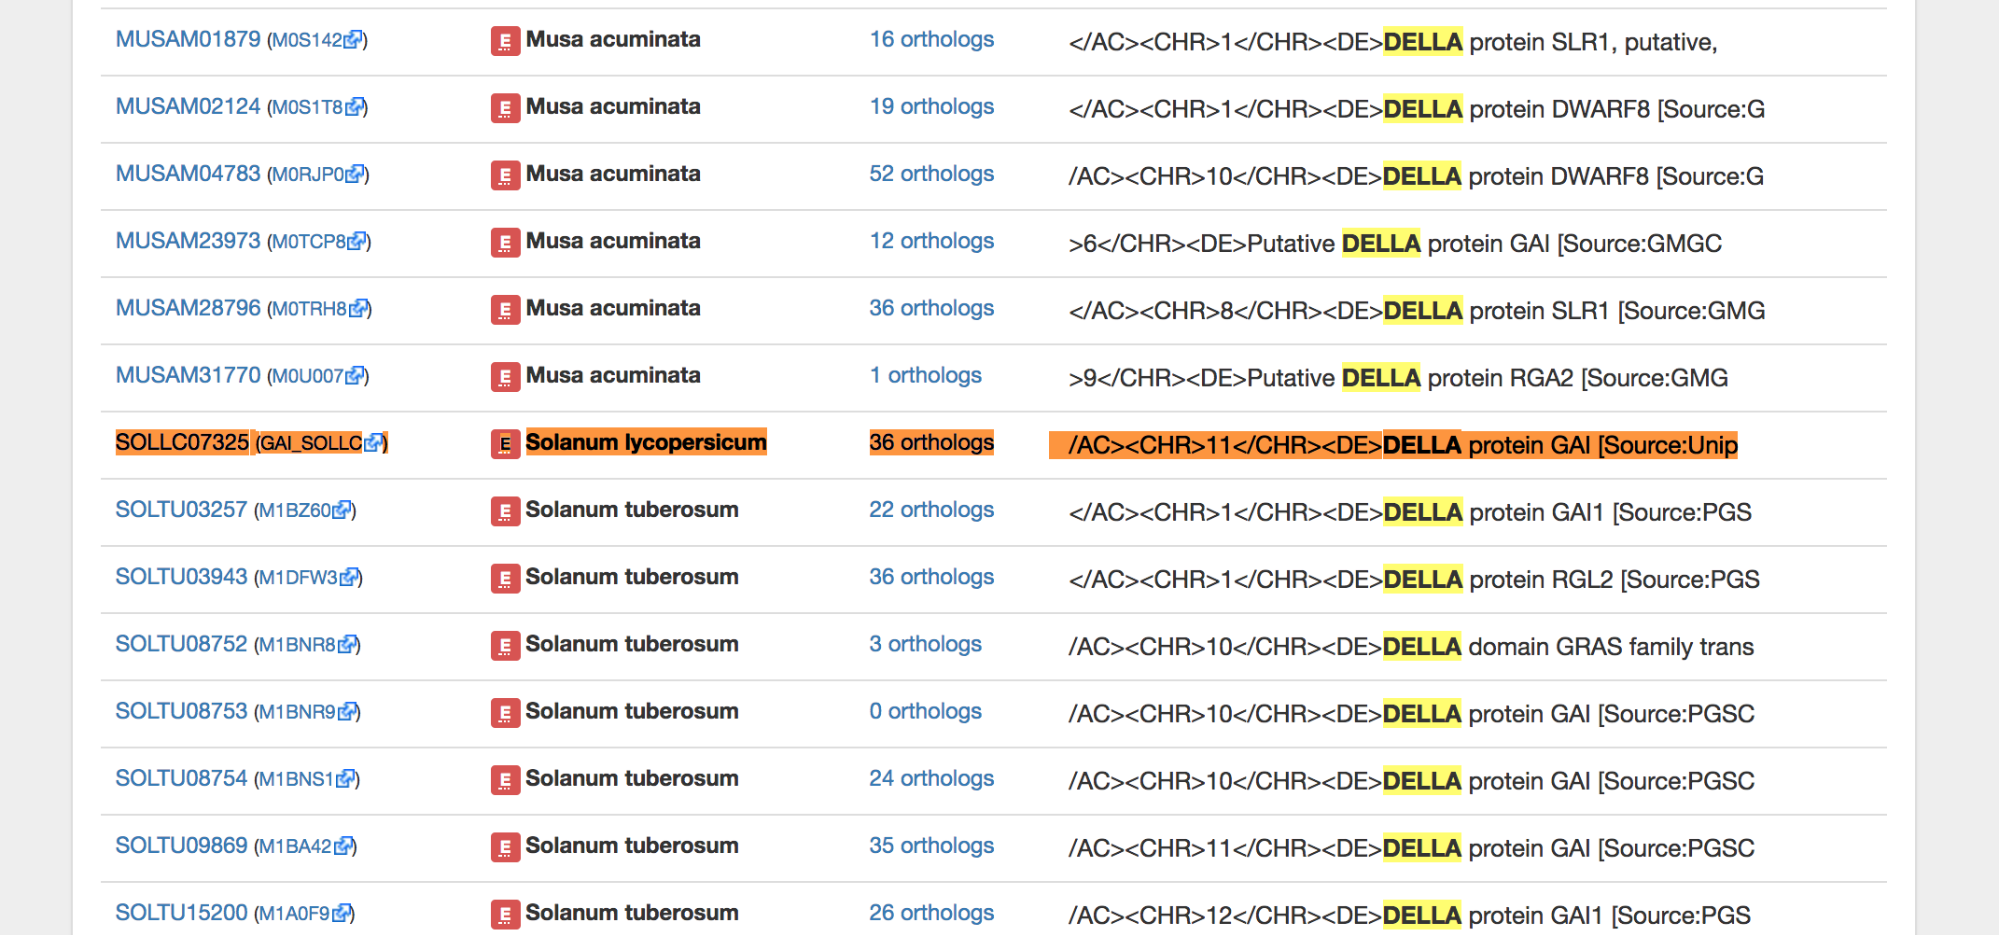
Many hits are found because many genes have DELLA in their name or description. Choose the appropriate one based on the species.
The first suggestion in Solanum lycopersicum is SOLLC07325 (this is the OMA ID).
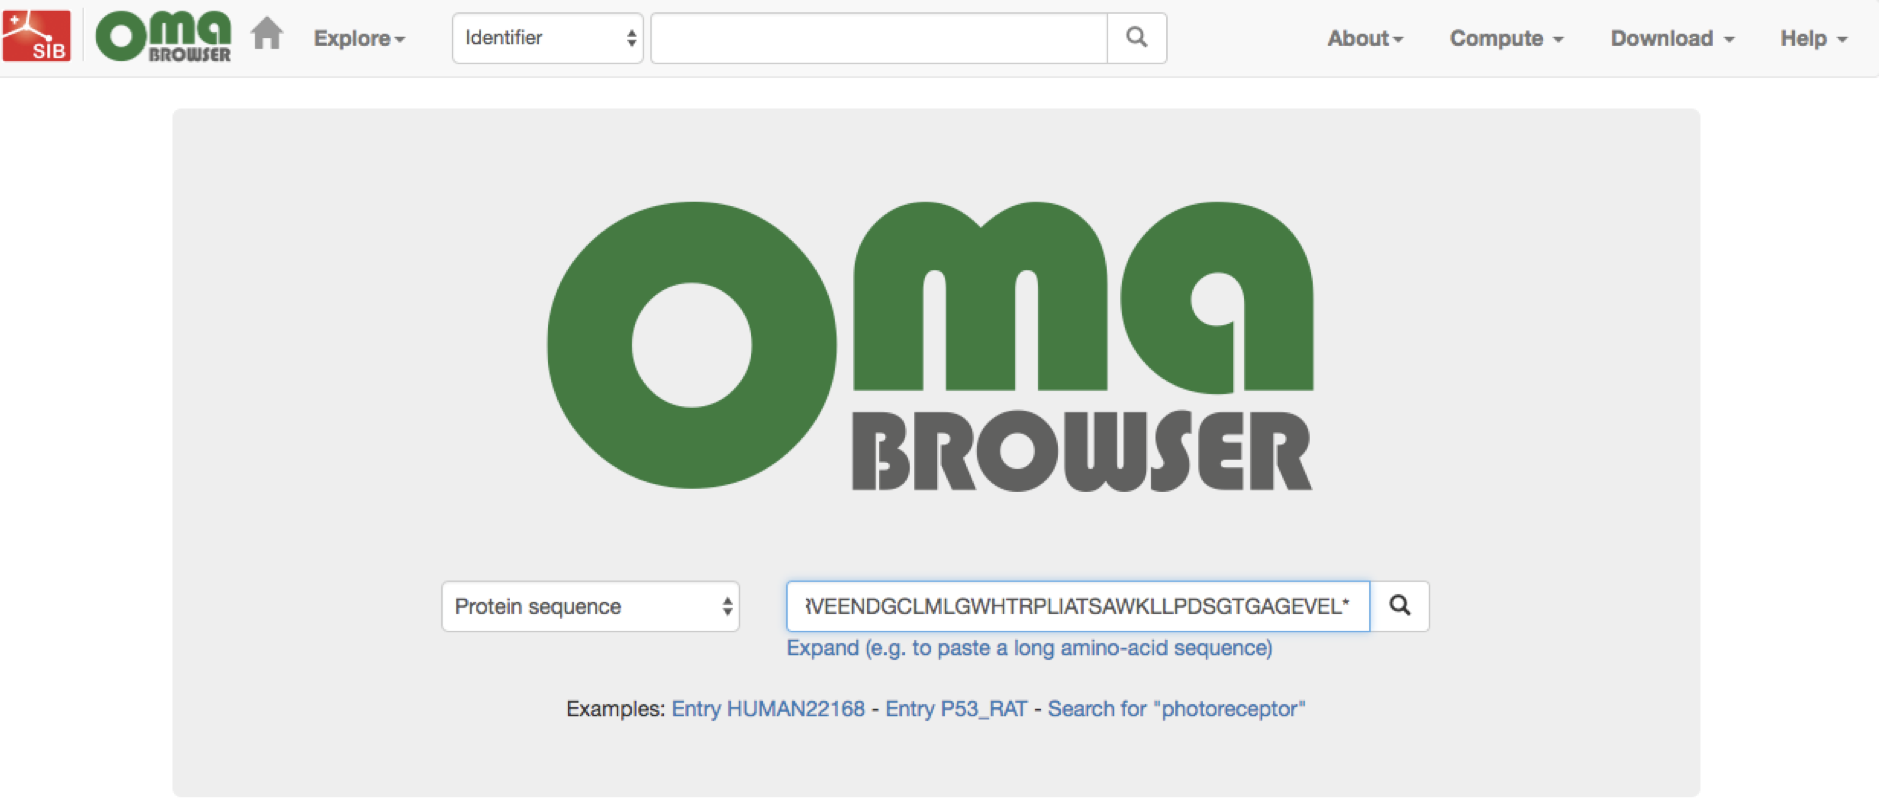
Copy and paste the sequence into search bar, the first hit should be your gene.
Because of the differences in identifiers across genome sources and versions, it is recommended to search by protein sequence in order to avoid any ambiguity!
For each gene, there is a number of external information that OMA provides. In this section, we describe how to access the General Information, IDs and Cross-references, Domain Architecture, and Gene Ontology annotations.
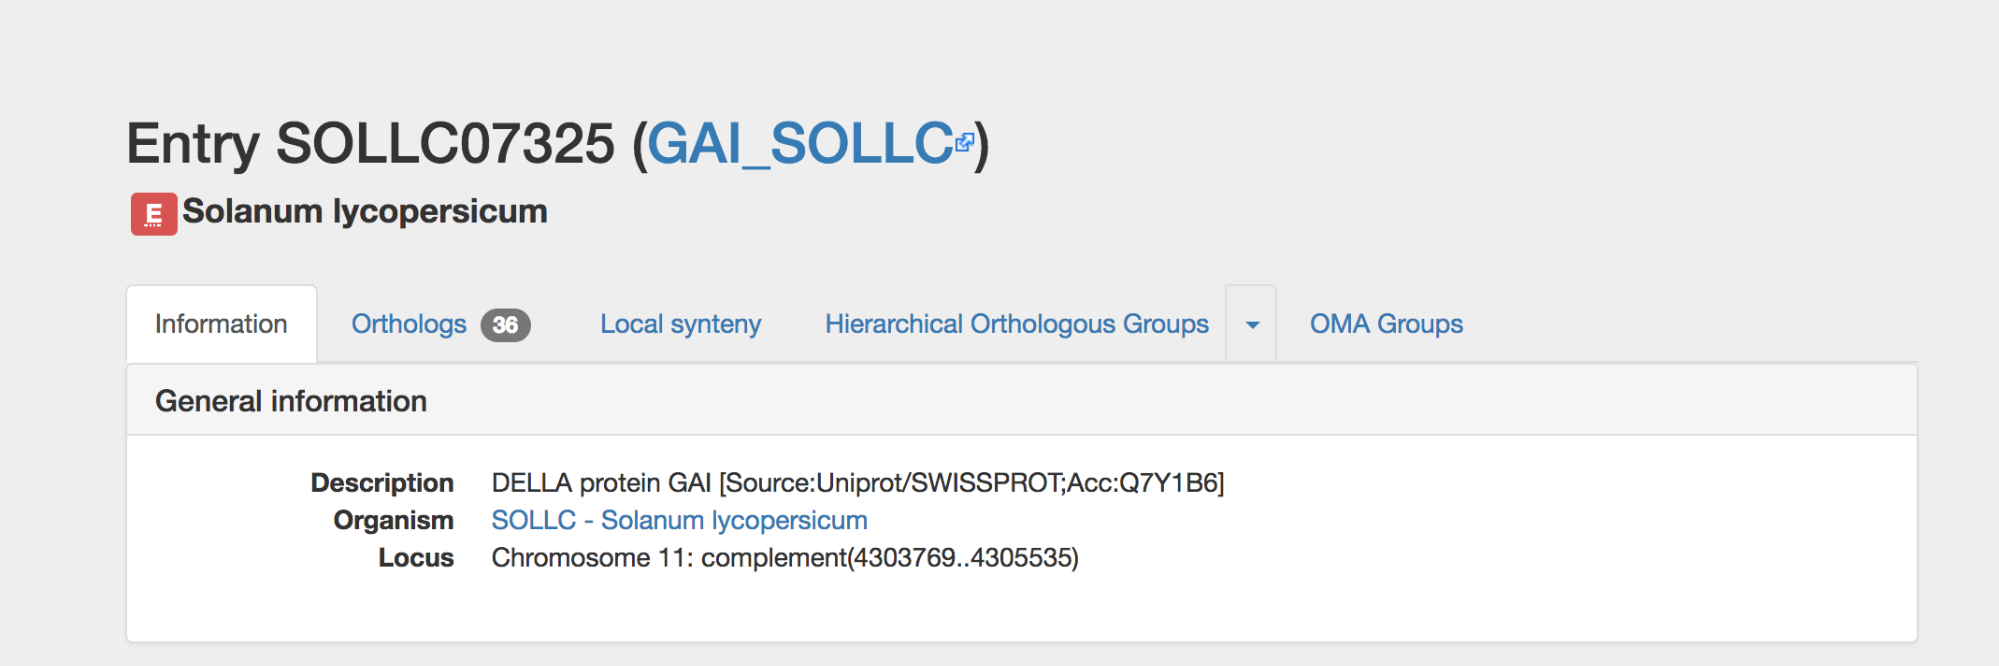
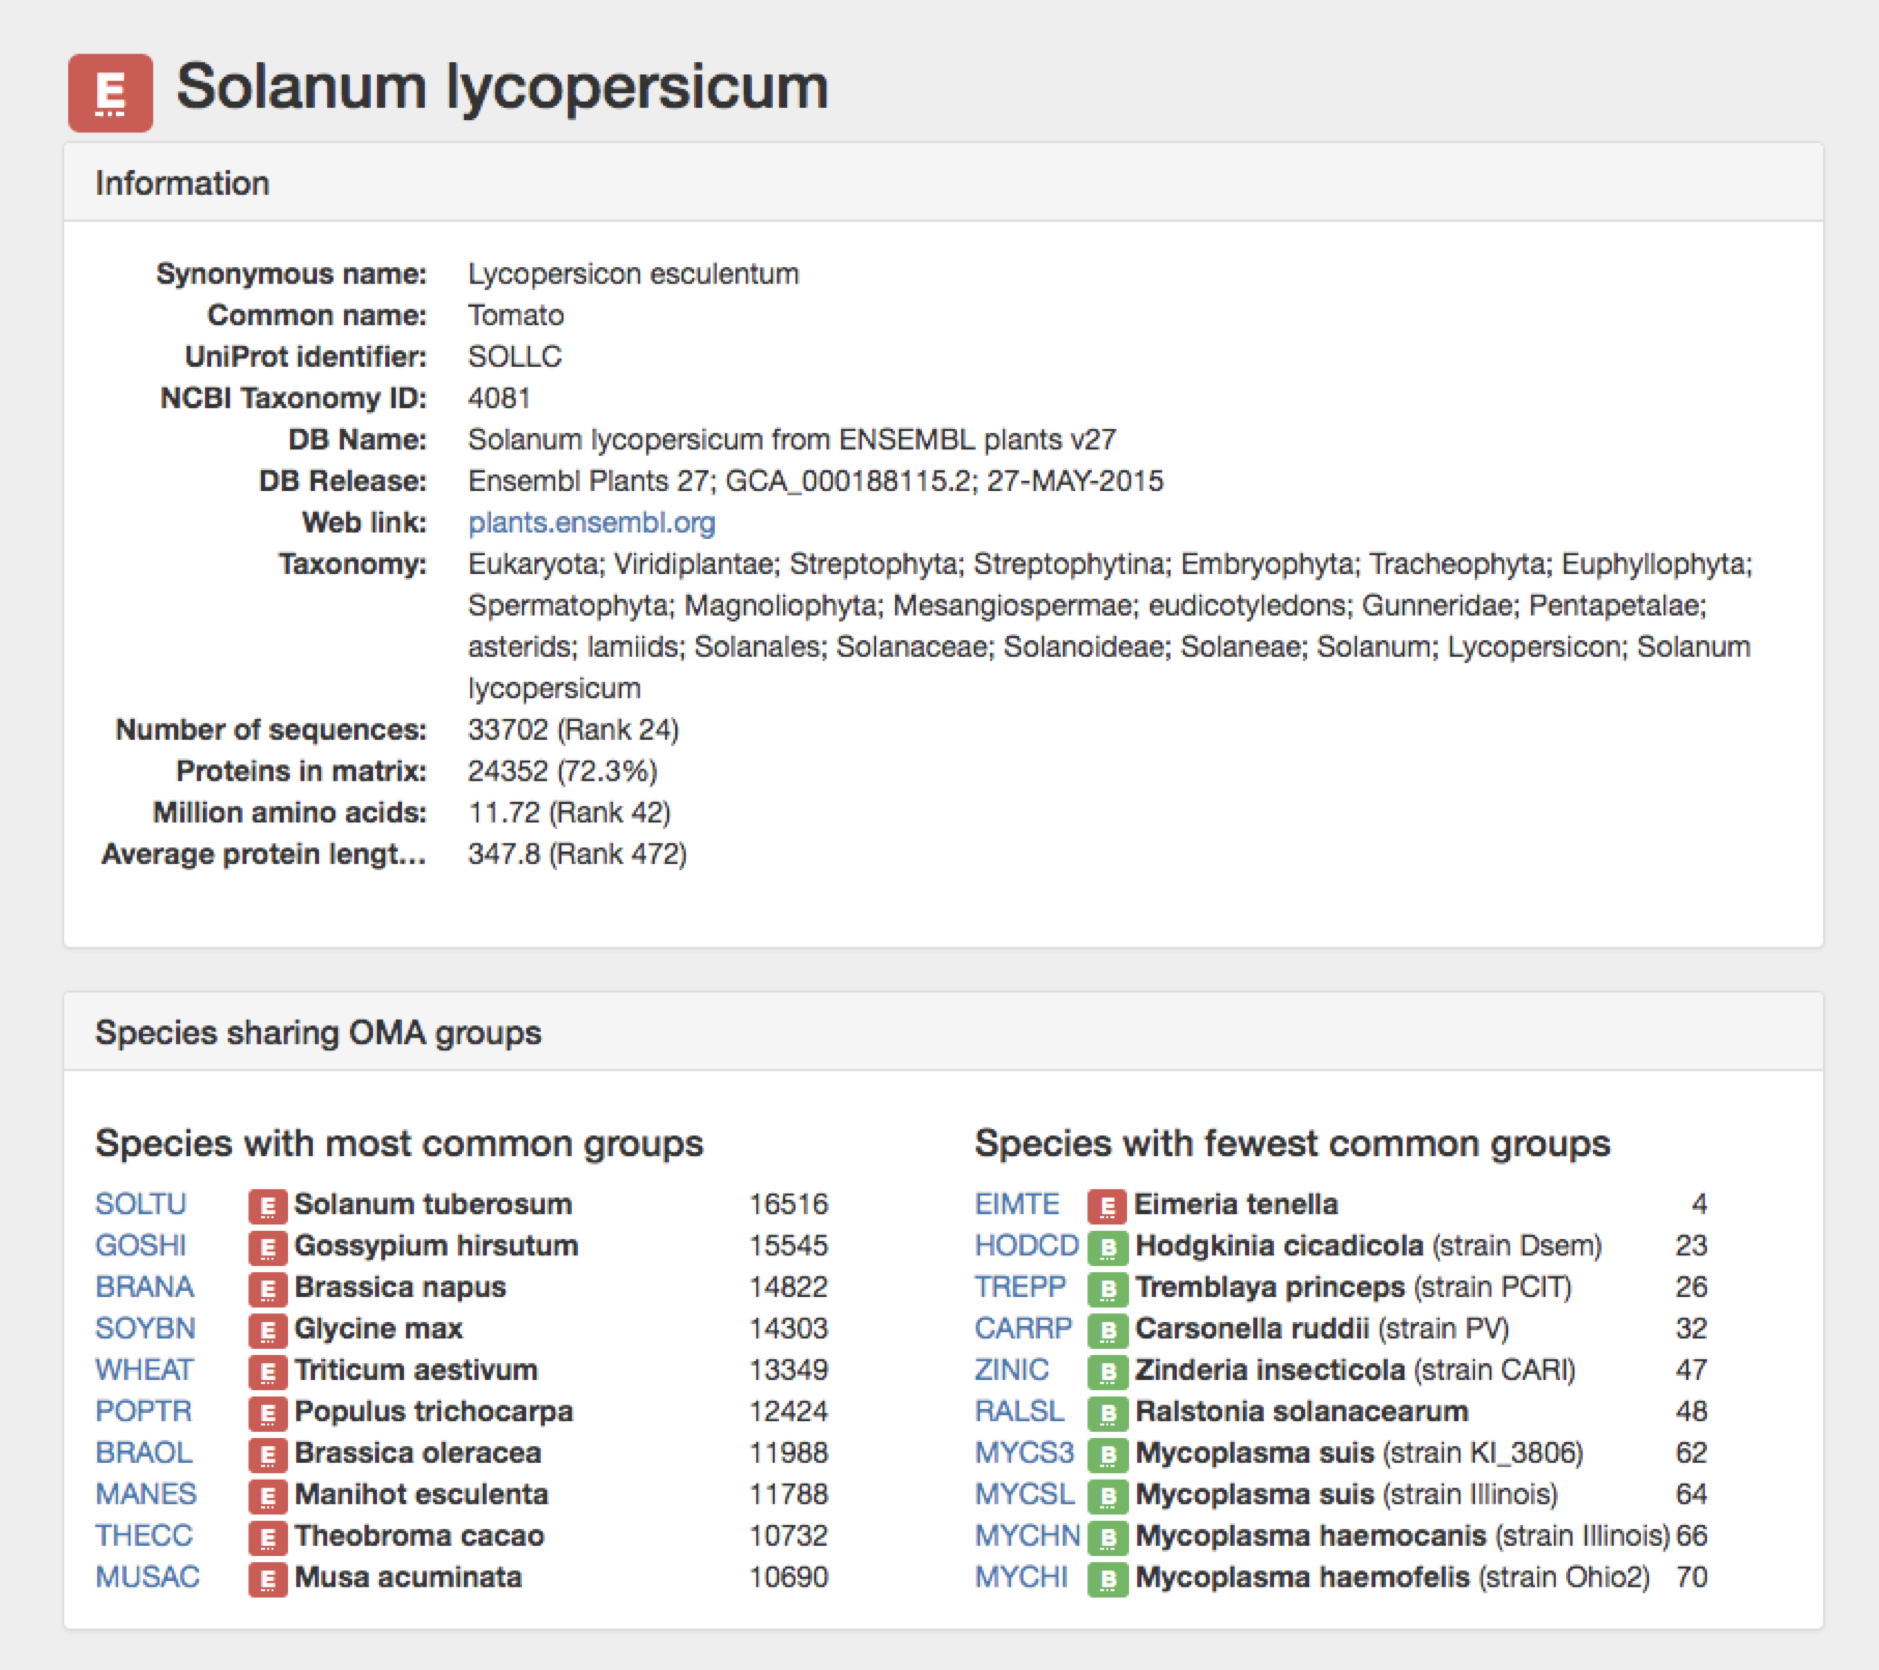
Get the general information of YFG by clicking on the Information tab. This is the landing page after searching YFG.
The OMA ID is displayed at the top, along with an external UniProt ID if relevant. The OMA ID consists of the 5-letter UniProt species code + a unique 5-digit number.
Click on the organism name link to go to that species’ information page.
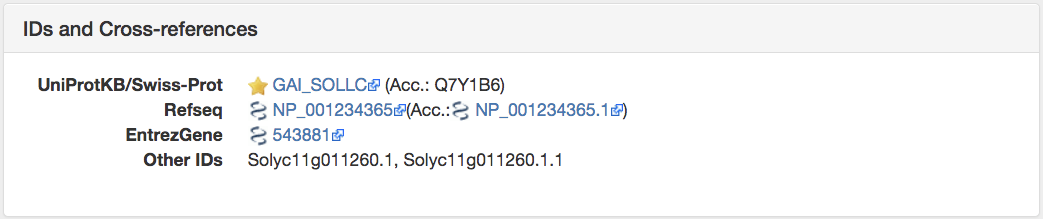
Get the IDs and Cross-references of YFG. This is the second panel under the Information tab.
Here the alternative IDs for YFG are listed. This may include the UniProtKB/Swiss-Prot ID, Refseq, EntrezGene, and Other IDs. Other IDs are usually genome annotation-specific for that particular organism. All Alternative splice variants for a given protein are represented as 1 OMA ID.
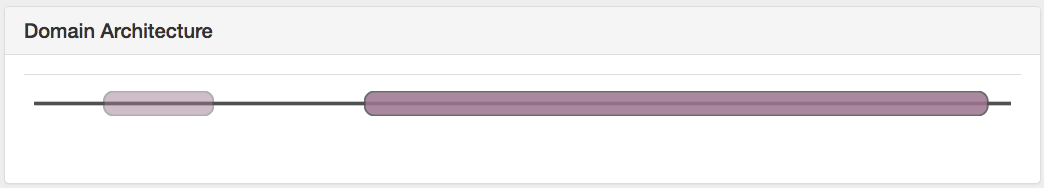
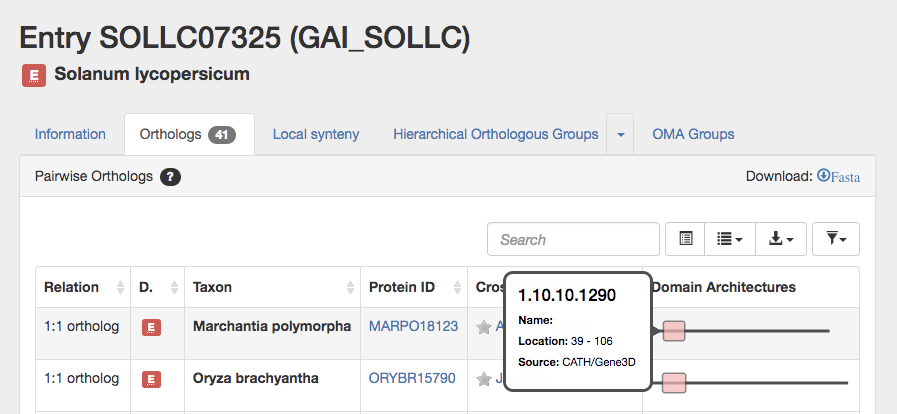
The 3rd panel on the information tab displays the domains, if available. OMA obtains the domain annotations from Gene3D, and currently 78% of all proteins in OMA have at least 1 domain annotation. Mouse over or click on the domain to see the name, location (amino acid position) and source.
Note that the colour hue corresponds to the domain architecture (according to the CATH classification). Different color intensities are used to differentiate domains of the same architecture.
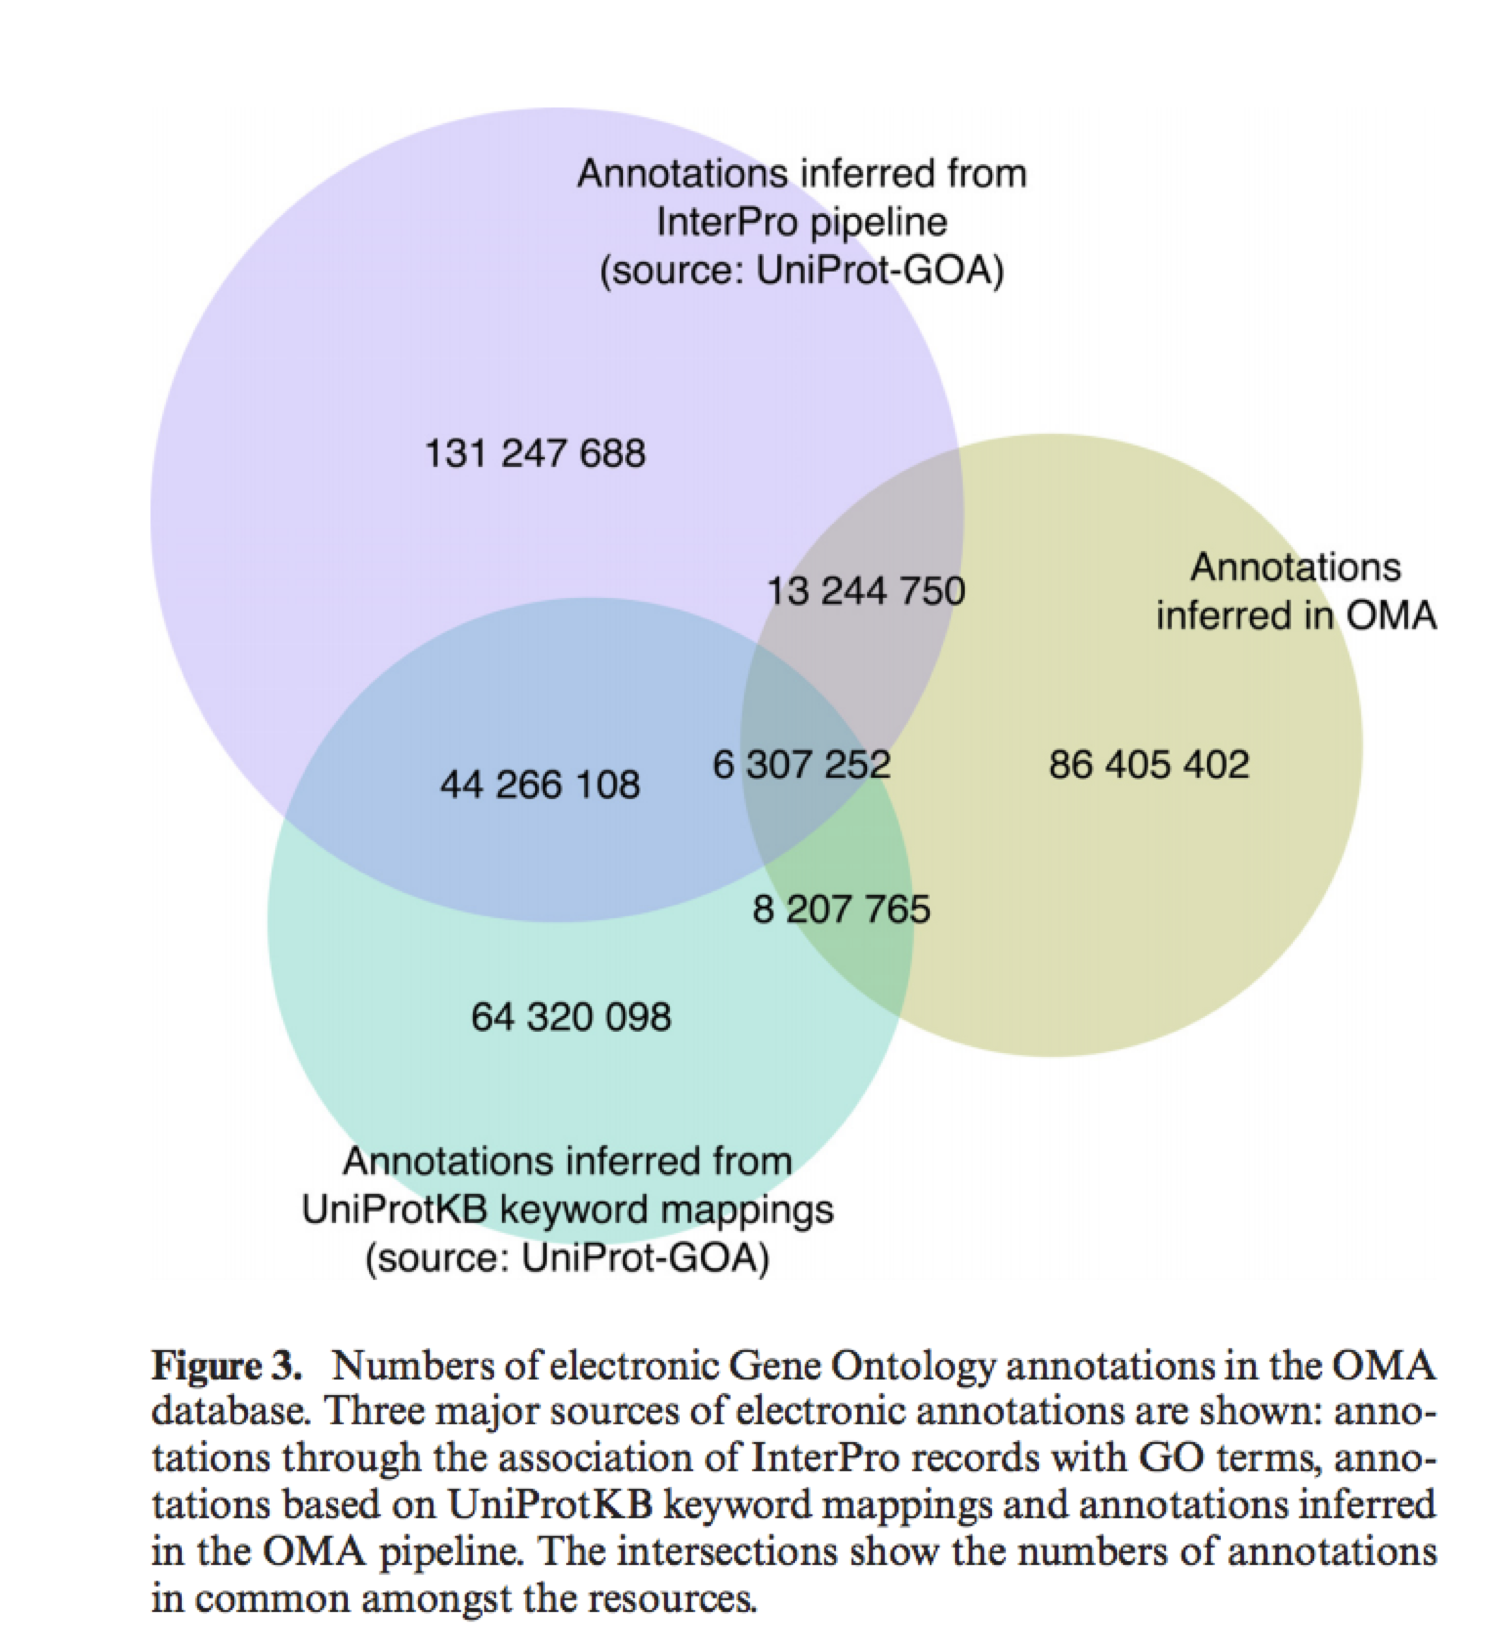
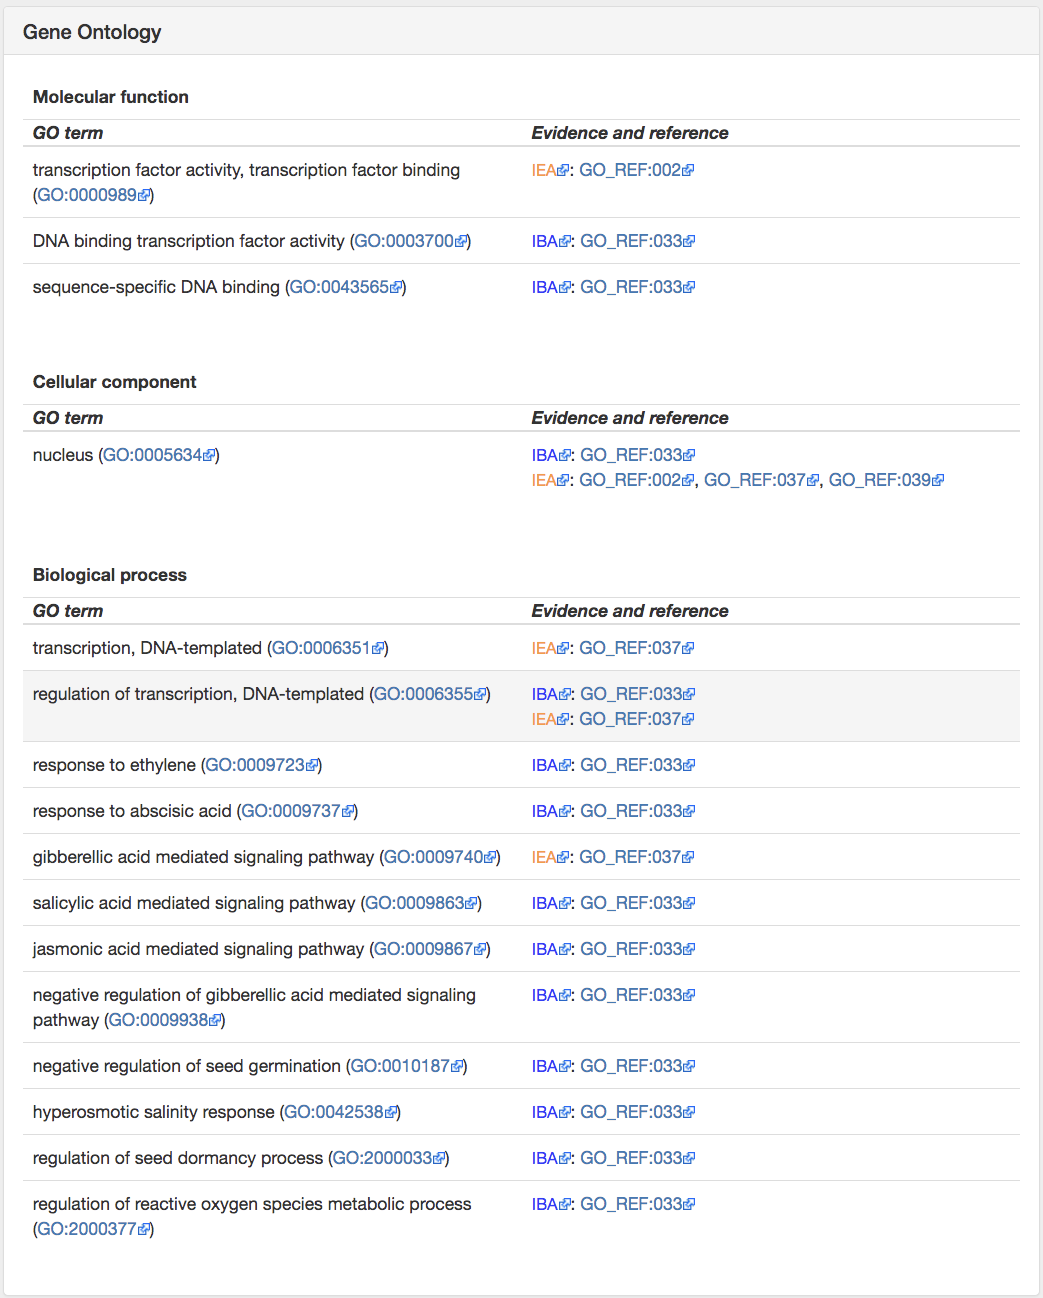
The 4th panel of the Information tab gives Gene Ontology (GO) annotations. GO annotations are important to infer the function of YFG. OMA provides GO annotations from the source, but additionally provides GO annotations which have been inferred based on OMA orthology relationships. OMA propagates GO annotations based on evidence codes EXP, IDA, IPI, IMP, IGI and IEP (http://geneontology.org/page/guide-go-evidencecodes) and then propagates throughout OMA groups.
Why should we use the OMA GO annotations?
There may be a difference between the GO annotations predicted by OMA and other databases. More information on how annotations are propagated in OMA:
https://academic.oup.com/nar/article/43/D1/D240/2438427#87022708.
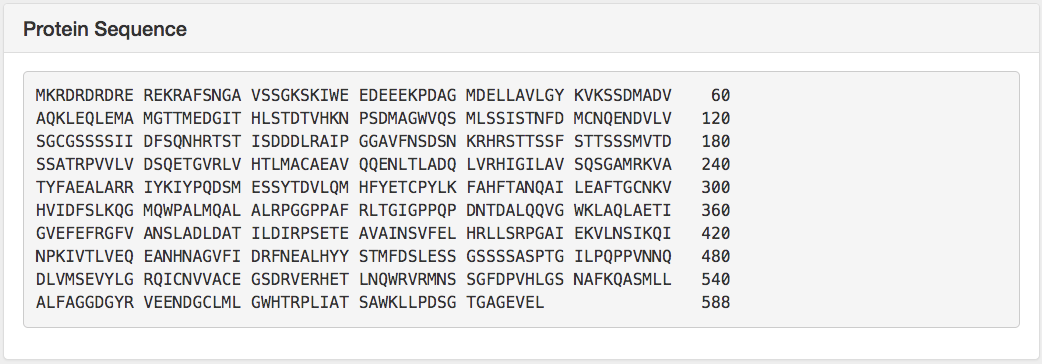
Copy the protein sequence of YFG.
Once you have found YFG in OMA, you want to retrieve the orthologs. There are several ways to do this. Keep in mind that OMA reports three “types” of orthologs: pairwise-induced orthologs, Hierarchical Orthologous Groups (HOGs), and OMA Groups. These are three different methods, so they might not report identical orthologs. However, HOG and OMA Group orthologs are based on pairwise orthologs so they should be similar. For more information, see: https://omabrowser.org/oma/type/.
Differences between pairwise orthologs and HOGs
| Pairwise orthologs | Hierarchical Orthologous Groups (HOGs) | OMA Groups |
Algorithm | Built by mutually-closest protein sequences within a confidence interval | Built by merging groups of pairwise orthologs at different taxonomic levels using a guide tree | Built by searching for cliques of pairwise orthologs (i.e. all genes that are pairwise orthologs to all others in the group) |
Genomes included | Compares 2 genomes at a time | Compares all genomes at a time | Compares all genomes at a time |
Types of homologs | Strictly orthologs, but can be 1:m or m:m | Groups of orthologs and in-paralogs | strictly orthologs, at most 1 per species reported, although there may be more not reported |
We will discuss the concept of HOGs in more details below, but meanwhile you may want to check out this 4-min YouTube video, in which we provide a gentle introduction to the concept: https://www.youtube.com/watch?v=5p5x5gxzhZA
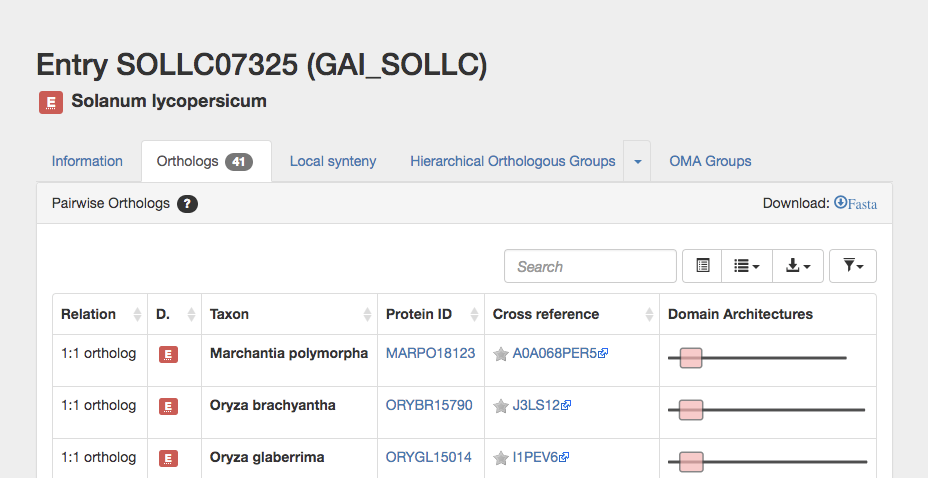
SOLLC07325, the DELLA protein in tomato from Guide 1 Example A.
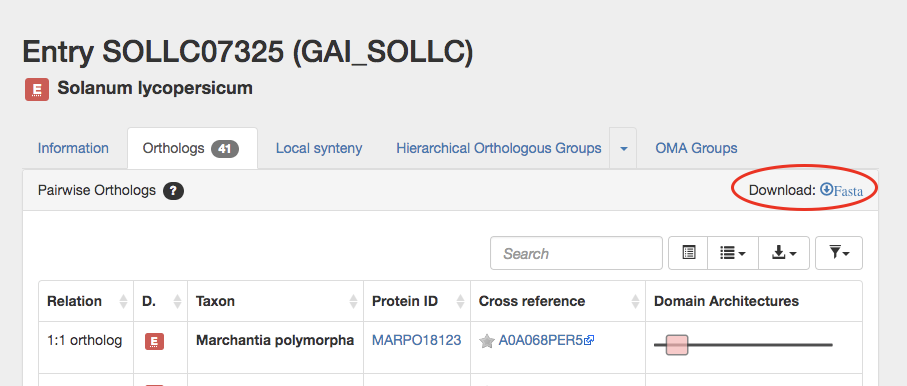
Click on the ortholog tab to list all pairwise orthologs.
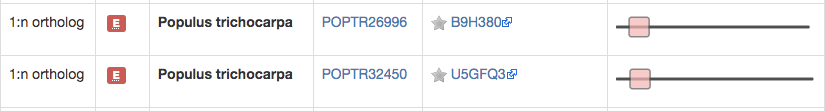
This takes you to the pairwise ortholog table, which gives the following columns:
Click on download fasta.
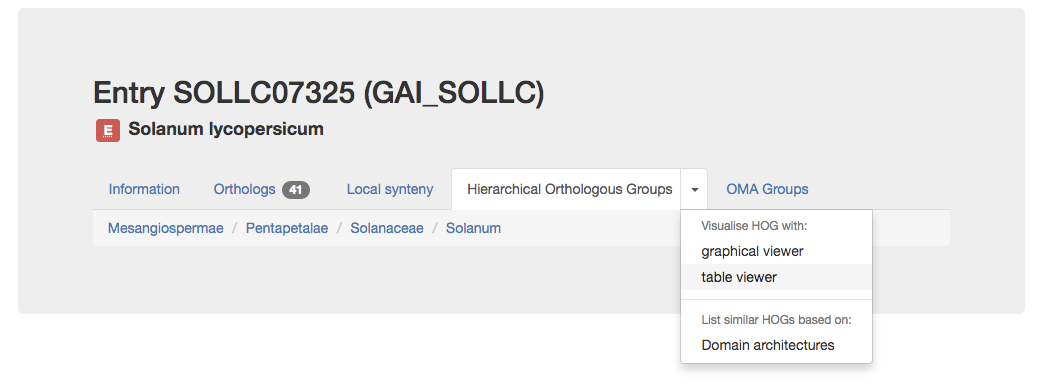
HOGs contain genes which descended from a common ancestral gene at a particular taxonomic level. Click on the table viewer subtab of the Hierarchical Orthologous Groups tab. Directly underneath the tabs you can see the different taxonomic levels for which this gene family has HOGs.
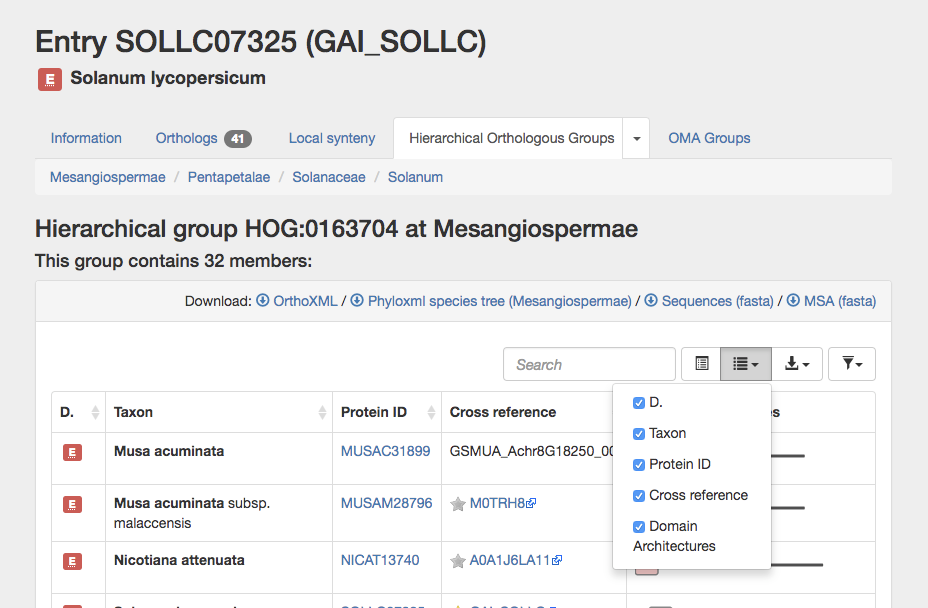
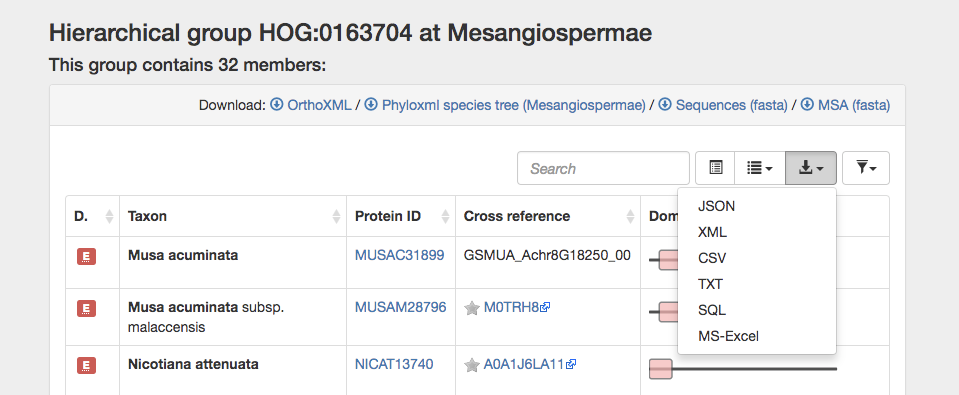
After clicking on the taxonomic range you are interested in, OMA displays the number of genes in the HOG at that level. The HOG table displays the Domain, Taxon (species), Protein ID, relevant Cross references, and Domain Architectures. Any of the columns can be sorted or removed from the display.
You can download the orthoxml, species tree (in phyloxml format), fasta sequences, or a computed multiple sequence alignment of the HOG members. Additionally, you can export the data in the table as a csv or other format for later use.
Example 2: Arabidopsis thaliana gene Q9SRX4 which is involved in pectin production.
Because this section makes extensive use of the concept of Hierarchical Orthologous Groups (HOGs), if you haven’t watched the brief introductory video on Youtube, we recommend that you do now: https://www.youtube.com/watch?v=5p5x5gxzhZA
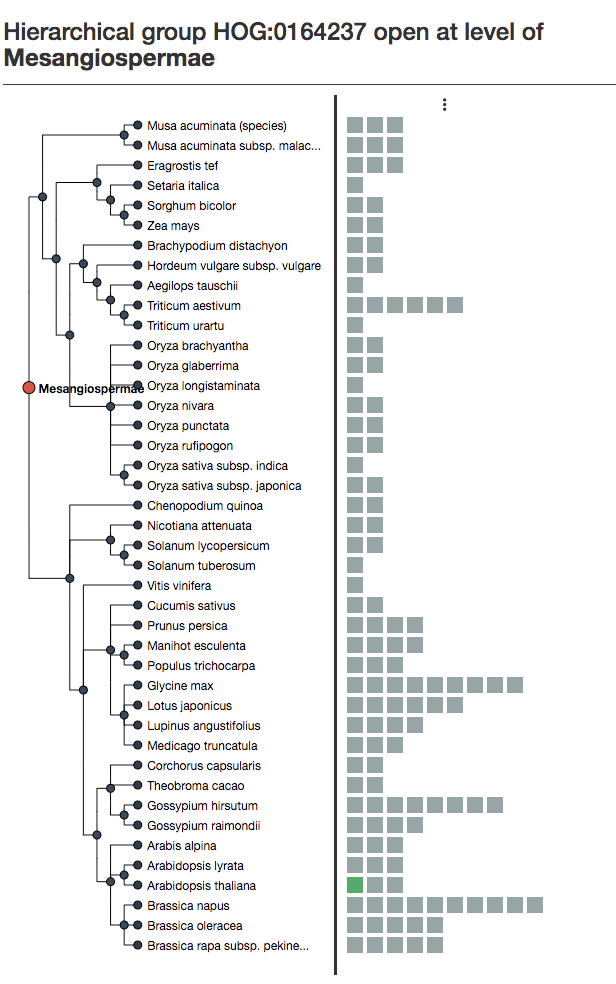
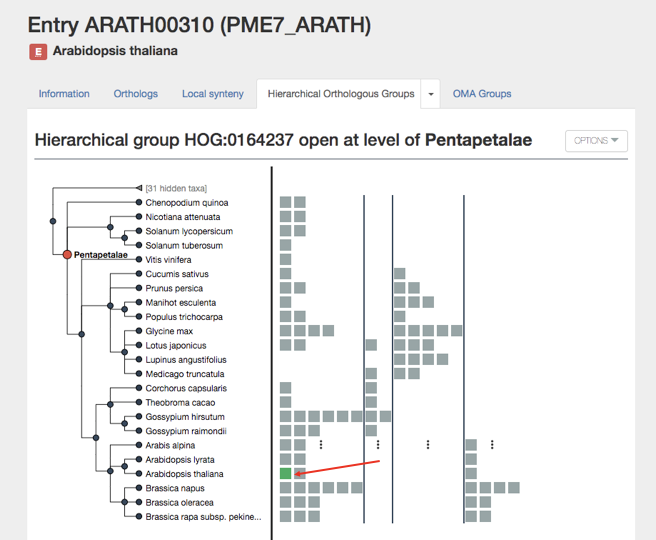
iHam is an interactive visualization tool for OMA. Each box is an extant gene. Our gene of interest is highlighted in green. Hover the mouse over it to get the ID and more information.
We can see at the Pentapetalae level, there were 4 ancestral genes, delineated by the vertical lines.
Each group of genes between the lines descended from one of those 4 ancestral genes. Thus, at this taxonomic level, we have 4 HOGs– each contains a cluster of extant genes.
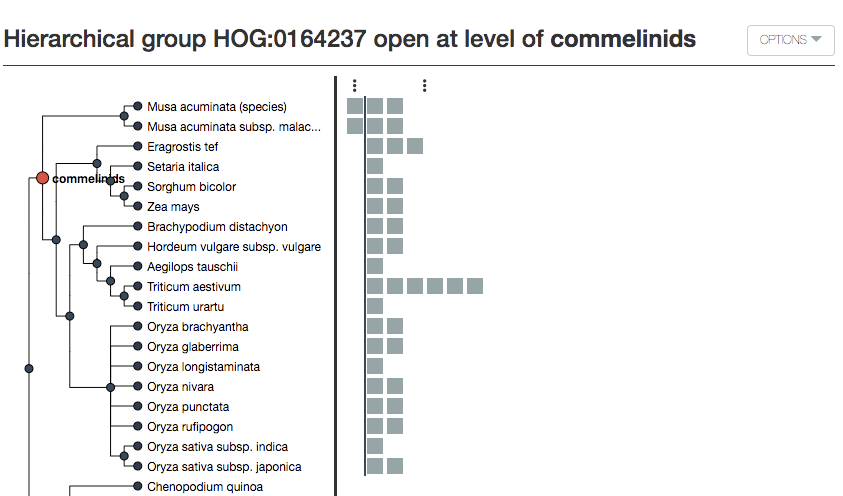
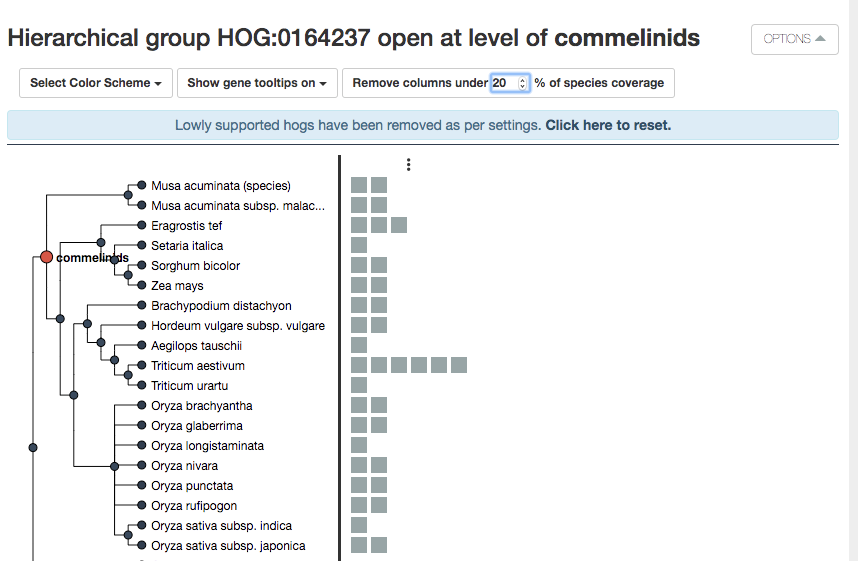
iHam displays orthologs paralogs predicted by OMA. However, some HOGs can be poorly supported. You can manually curate the tree by removing HOGs below a certain threshold of species coverage. In the above example, both species of Musa acuminata are the only species in one of the HOGs at the commelinids level. This either represents a loss at the Poaceae level, or a problem with the orthology inference, often due to imperfect genome data. Therefore OMA allows you to filter out columns (HOGs/putative ancestral genes) based on species coverage.
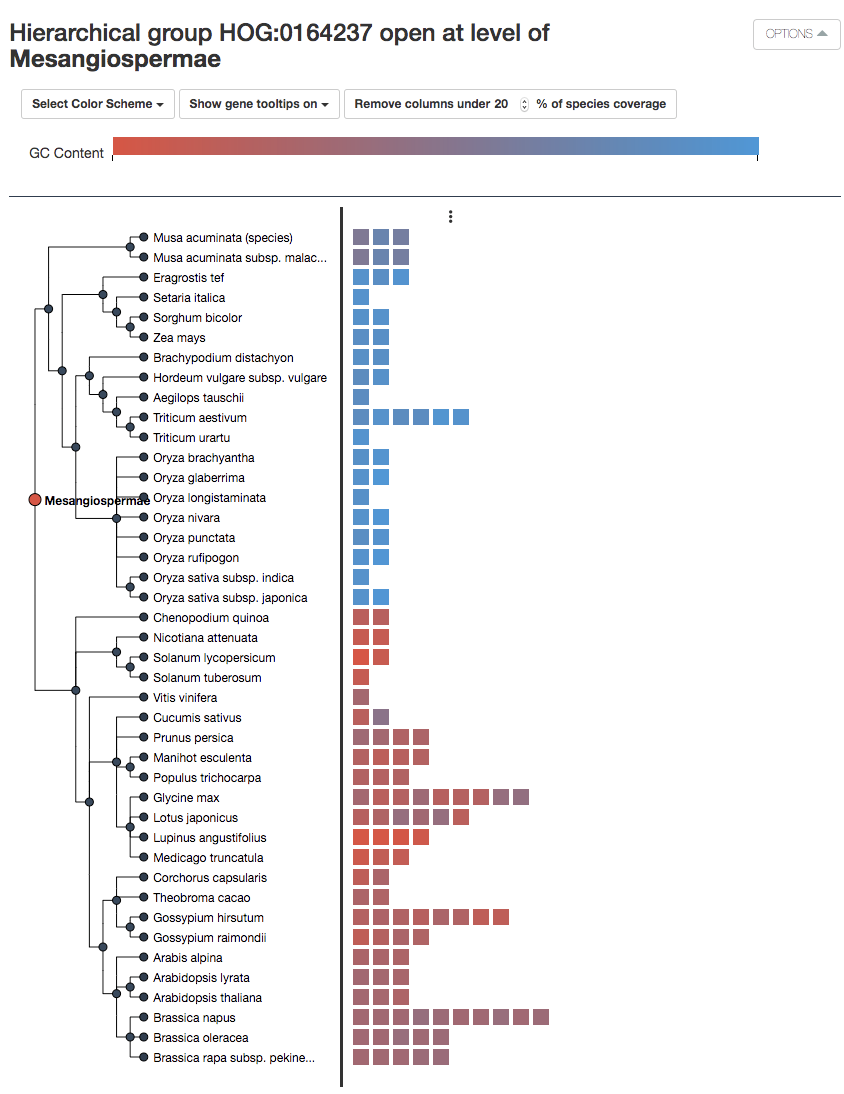
Additionally, in HOGvis you can color the genes according to either the protein length or GC content.
Because of the interactivity of HOGvis, traversing along the species tree allows us to infer where OMA predicts duplications and losses of ancestral genes.
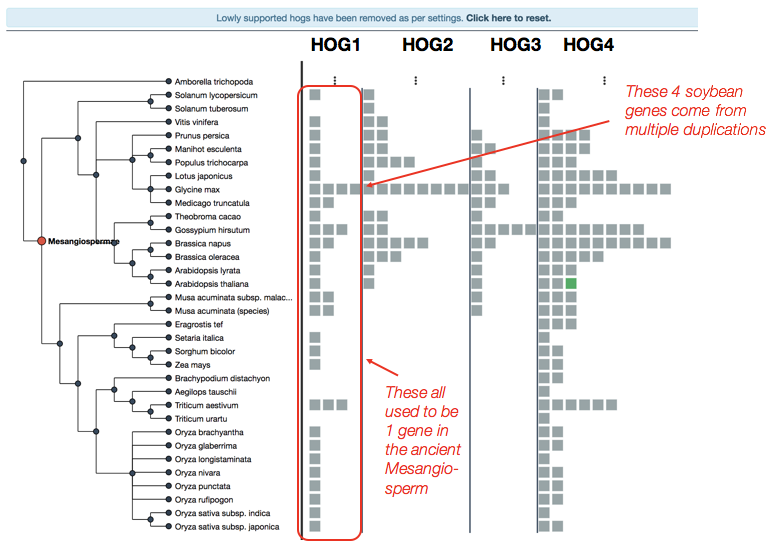
In our example, we can see all the genes in our modern extant species which came from a single ancestral gene in the ancient Mesangiosperm.
The number of duplicated genes can be inferred by the number of genes in the HOG.
For example, there are 4 genes in soybean (Glycine max)– 3 of these came from duplications which happened after the Mesangiosperm speciation.
We can also see that the gene coming from ancestral gene #2 and #3 have probably been lost in the monocots (at the commelinids taxa level). Actually, we can see that the dicots in general have many more copies of this gene than the monocot, which makes sense, considering the literature has described how dicots have different cell wall structures than commelinoid monocots, and are known to be pectin-poor!
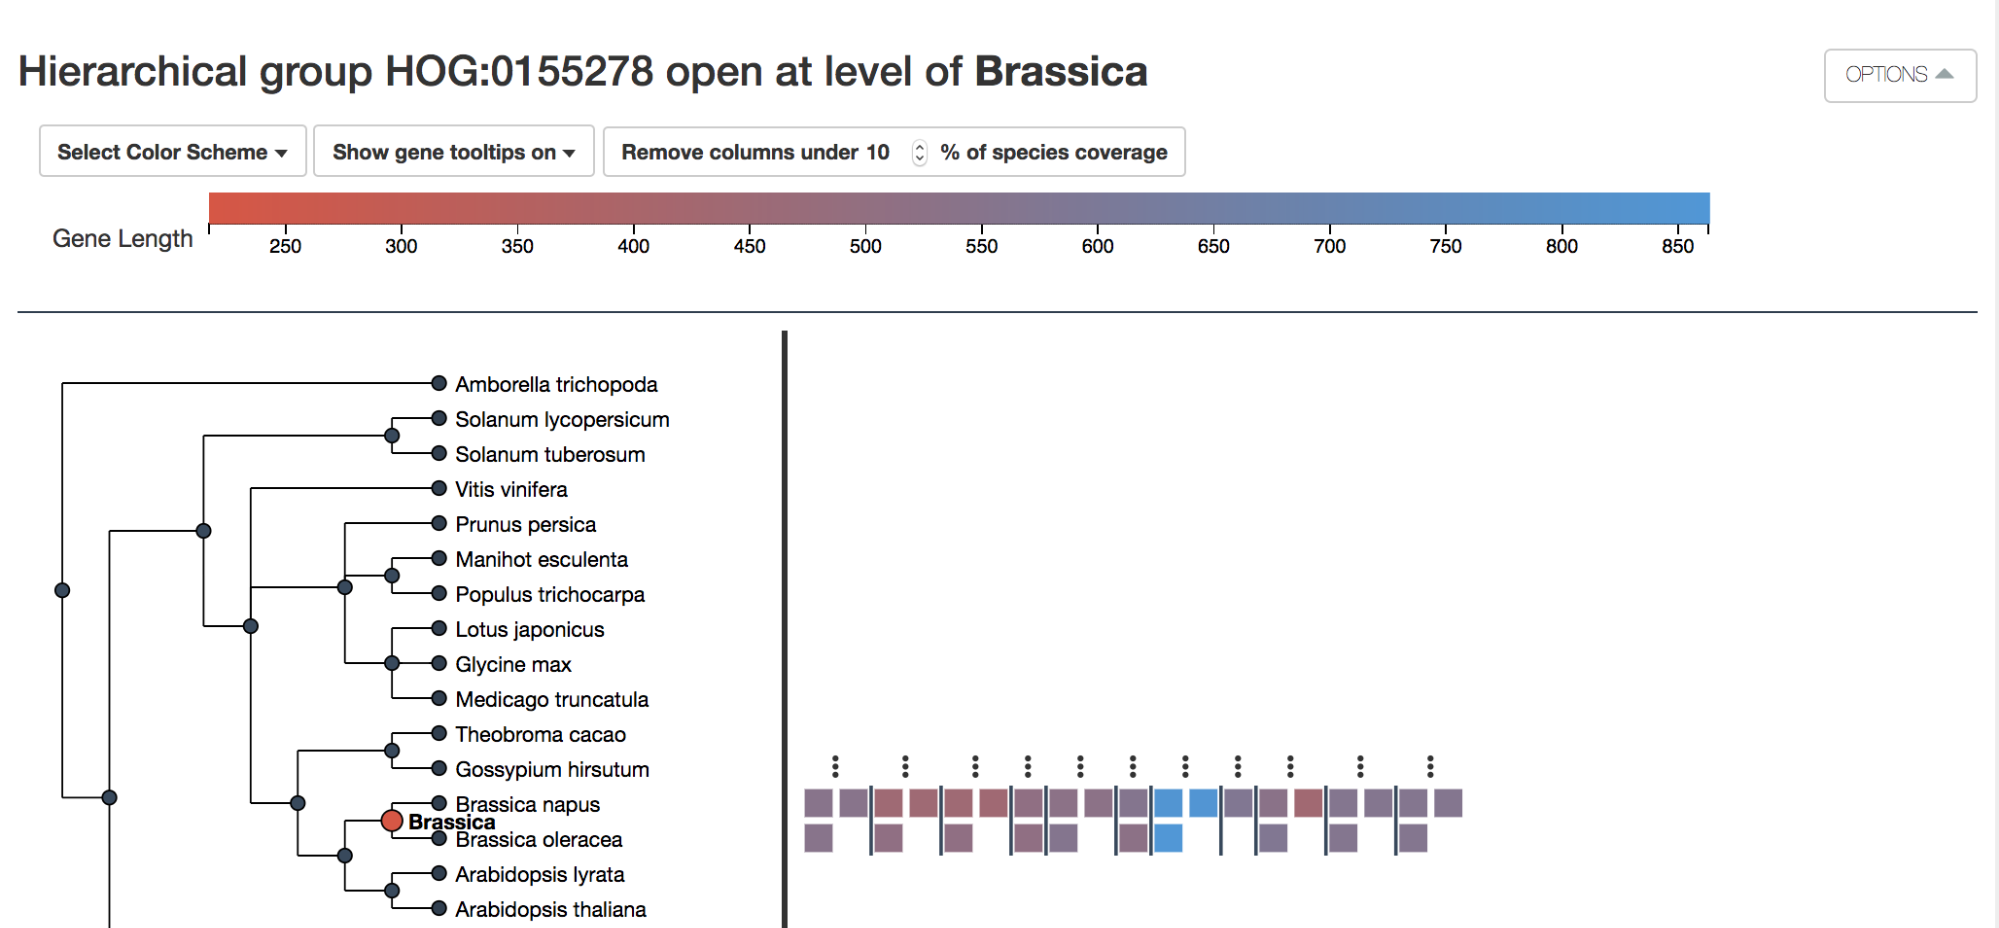
Dynamically interact with HogVis by clicking on the different nodes.
In our example, B. napus has undergone a whole genome duplication– hence the near systematic doubling of B. oleracea genes within every HOG.
That concludes the 4-part “OMA How-To” guides. Is there something you’d like to see covered in a How-To? Email the OMA team at: contact@omabrowser.org.
More info: